Norwegian Cruise Line: Ticket and Onboard Up for Q3, Offset by Costs

Norwegian Cruise Line Holdings (NCLH) reported a net loss of $295.4 million on revenues of $1.6 billion for the third quarter ended Sept. 30, 2022; compared to a net income of $450.6 million on revenues of $1.9 billion for the third quarter of 2019, the last “normal” year.

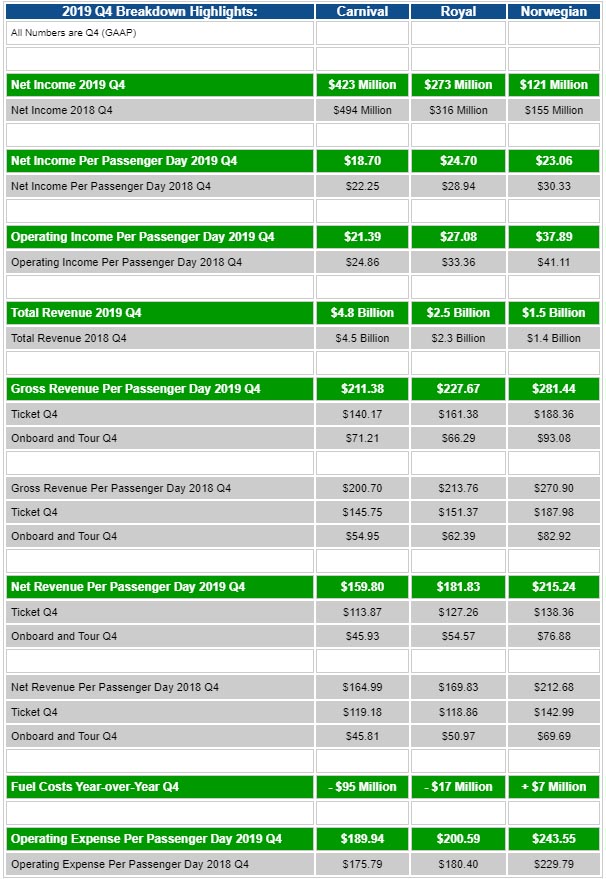
Ticket revenue per passenger day was $277.69 in 2022 up from $254.99 in 2019, and onboard revenue per passenger was $127.95 this year, up from $100.24 in 2019.

Increased revenues, however, were offset by increased total operating costs: $311.08 per passenger cruise day in the third quarter of this year compared to $183.89 for the same period in 2019. The biggest cost drivers were fuel, which nearly doubled, and food costs, which were also up, as well as so-called “other” expenses.

Marketing and administrative costs were also up significantly as interest expenses.

Commenting on the cost picture, Mark Kemp, CFO and senior vice president, said the company is taking actions to right-size costs and noted that will settle as the inflation situation will not last. He noted that the cost for certain food categories was already trending down.

Cruise Lines 2019 Q4 Breakdown: By the Numbers

Seabourn, Royal Caribbean and AIDA Ships in Antigua

Cruise Industry News takes a look at the financial performance of the “big three” following the final quarter of 2019.

Takeaways:

While gross revenue was up for Q4 2019 for the three publicly-traded cruise companies, increased operating expenses led to reduced operating income, net income and net income per passenger day, compared to Q4 for the previous year.

Net revenue per passenger day was also down year-over-year for Carnival Corporation, up noticeably for Royal Caribbean and up slightly for Norwegian.

Gross revenue per passenger day was significantly up for all three companies, including onboard spending, with gross ticket revenue per day also up for Royal Caribbean and Norwegian, but down for Carnival.

Carnival saw the biggest difference between gross and net onboard revenue: more than $25, making it flat with last year, while Royal had nearly a $12 drop and Norwegian a little more than $10, and up from last year.

Both Carnival and Royal Caribbean saw a decrease in fuel costs year-over-year while Norwegian saw its fuel spend to go up.

Carnival cited the regulatory change preventing travel to Cuba, geopolitical events in Arabian Gulf, Hurricane Dorian, an unscheduled drydock, and multiple shipyard delays. Royal cited the Oasis drydock mishap, Cuba and Hurricane Dorian, and Norwegian also cited Cuba and Dorian.

Because of the fleet mix, Norwegian continued to generate the highest gross and net ticket and onboard spend revenue.

2019 financeCruise Industry Financial Tracking

The Cruise Industry Financial Tracking Report provides an in-depth look into the financial metrics of the leading cruise companies. Learn more.

Included: Carnival, Royal Caribbean, Norwegian, MSC, Star/Genting, Royal Olympic, P&O Princess, Regent, American Classical Voyages and Commodore.

Key metrics include revenue, operating expenses, operating income and net income, as well as those metrics on a per passenger day basis. We also look at EPS, fleets, berths and passenger cruise days.

Higher Ticket Prices and Onboard Spend Primary Drivers for Royal Caribbean’s Q2

Symphony of the Seas

With capacity up 2.6 per cent, higher ticket prices and onboard revenue were the main drivers for Royal Caribbean Cruises reporting record results today in the second quarter.

Royal Caribbean reported net income of (GAAP) $466.3 million, or $2.19 per share, on revenues of $2.3 billion for its second quarter ended June 30, 2018, compared to net income of $369.5 million, or $1.71 per share, on revenues of $2.2 billion last year.

Ticket revenue per passenger day was $163.76 for the second quarter of this year, compared to $158.92 last year and the onboard spend was $65.12 compared to $61.70 per passenger last year.

Operating expenses rose moderately at $128.70 per passenger day with increases in all expense categories, from $126.30 last year.

With operating income of $456.9 million this year, up $37.2 million from $419.7 million, $9.4 million in interest and other income this year, compared to a $50.2 million in interest and other expenses last year, contributed further to boost net income to $466.3 million over $369.5 million.

The increase in per share income was also boosted by fewer outstanding shares, a result of Royal Caribbean’s share buyback program. Outstanding shares numbered 212.5 million, compared to 216.1 million for the same period last year.

Royal Caribbean reported 10,213,067 passenger cruise days this year, up from 9,950,570 passenger cruise days last year, and 1,461,055 passengers, compared to 1,433,339 in 2017.